<- Back to Templates
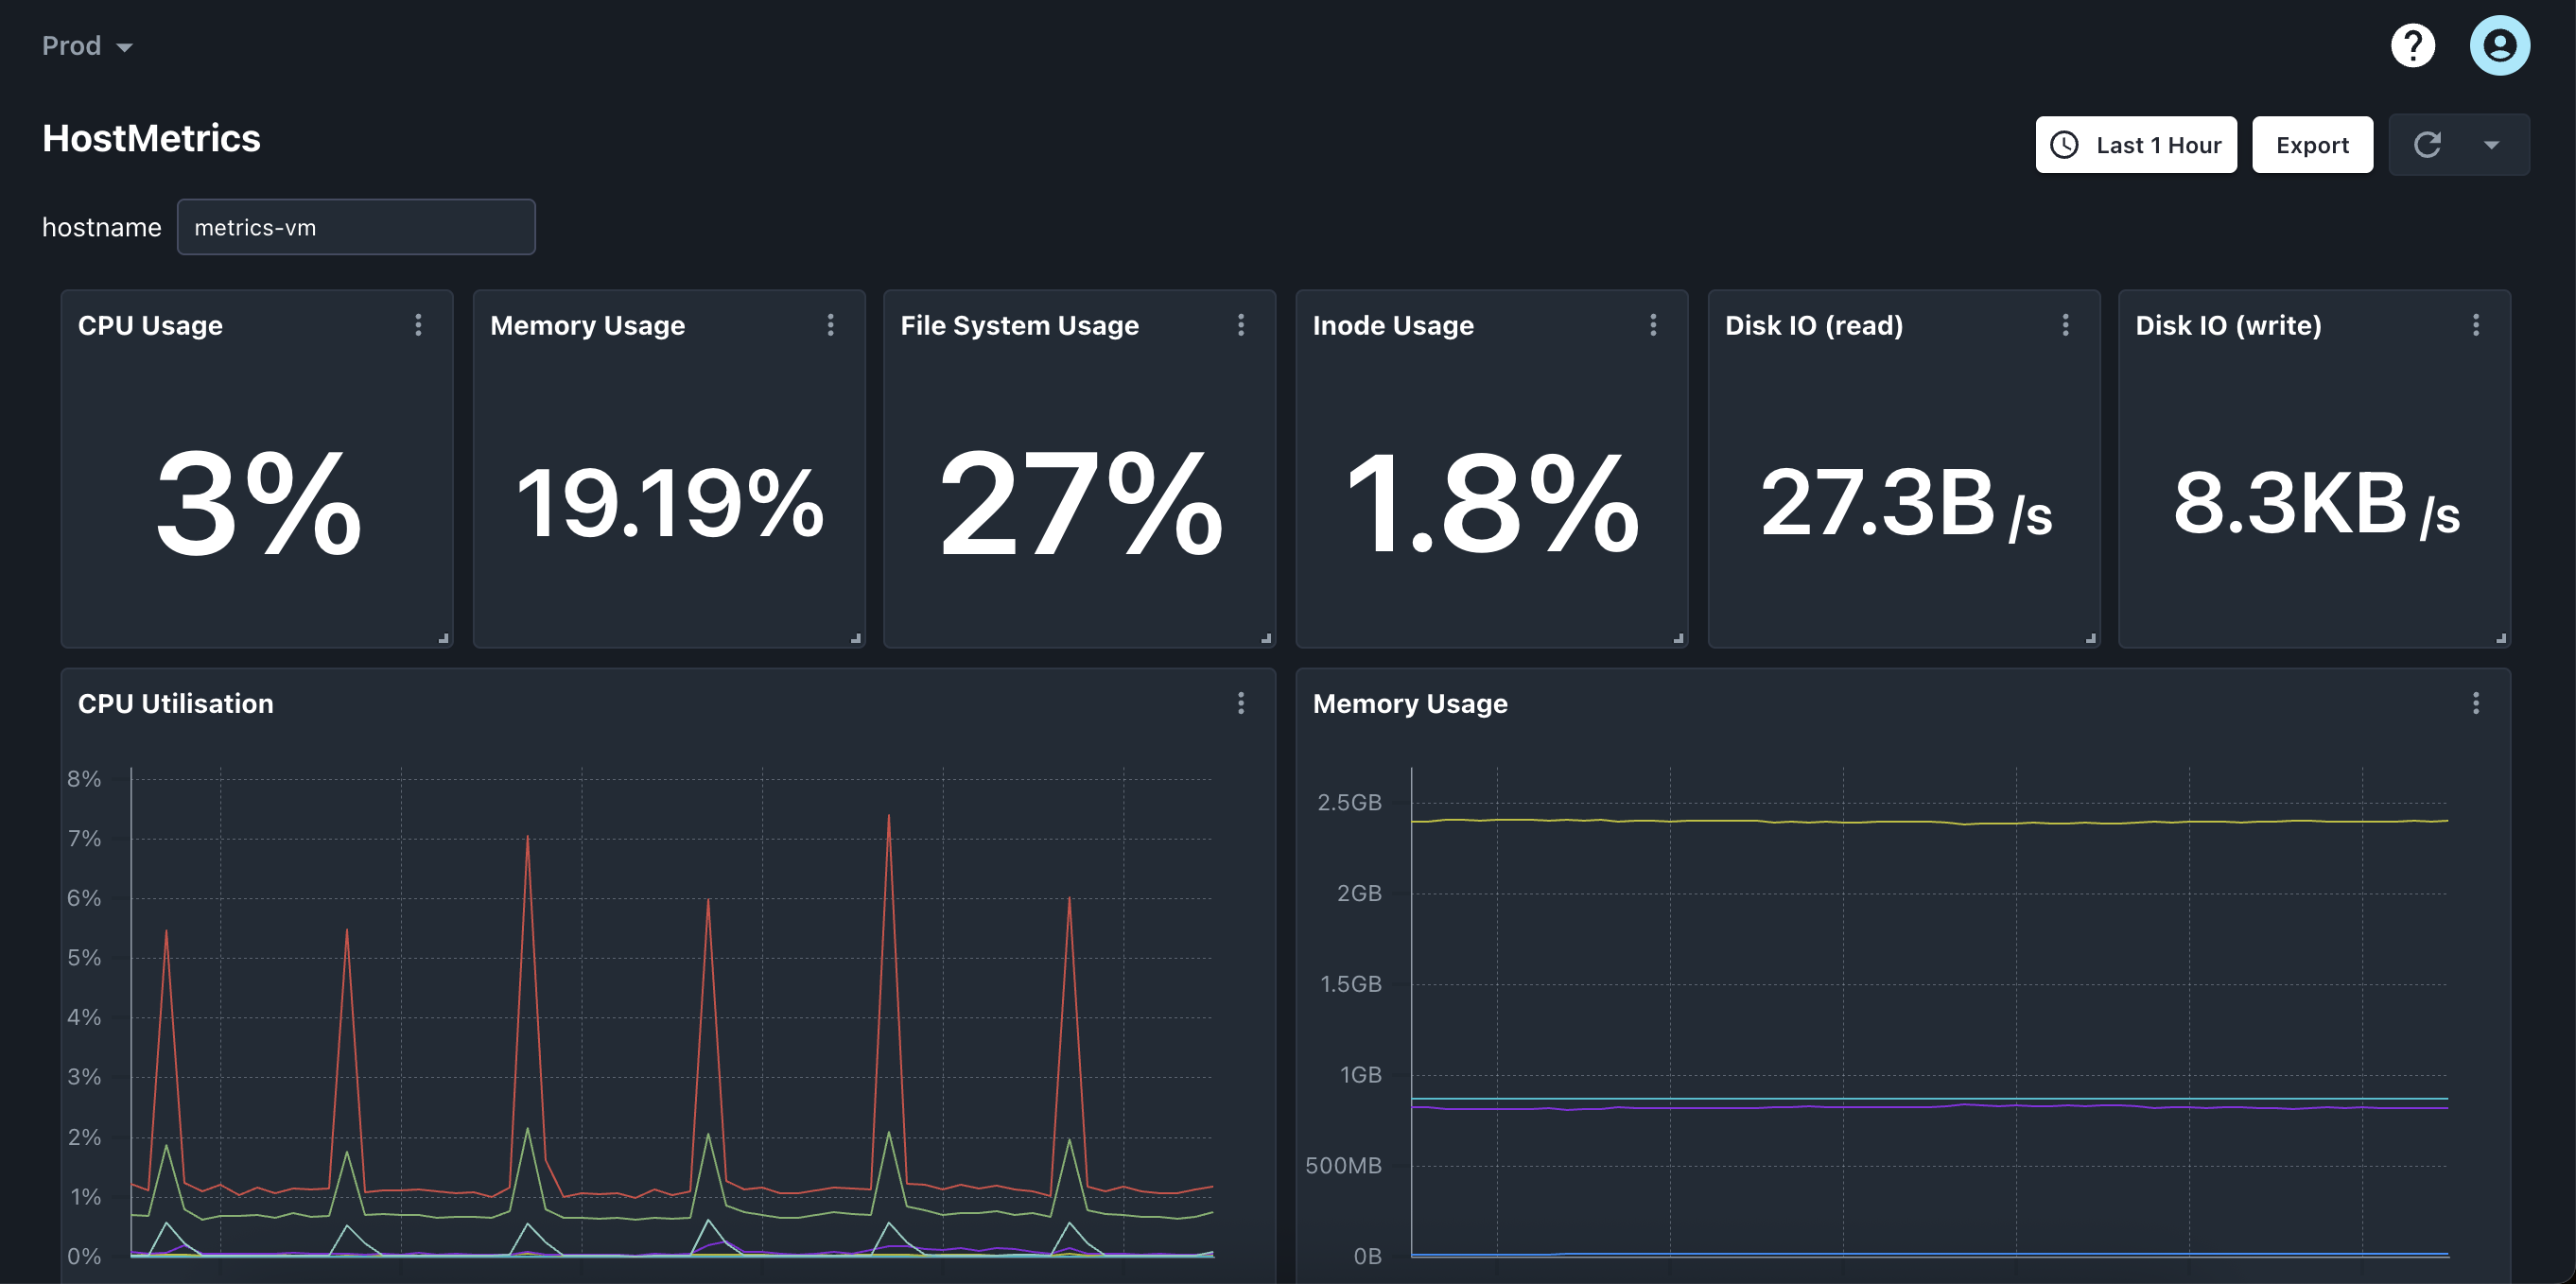
Host Metrics
By KloudMate
Gather various system-level performance indicators directly from host's operating system. These metrics provide insights into the resource utilization and health of the physical or virtual server where the Collector is deployed as an agent.
Template JSON
{
"name": "Host Metrics",
"description": "",
"data": {
"tz": "local",
"links": [],
"panels": [
{
"id": "0lnihagpoyp",
"tz": "local",
"axis": {
"x": {
"date_style": "auto"
}
},
"title": "Memory Usage",
"panelType": "STATS",
"timeRange": "10m",
"statConfig": {
"format": "percentage",
"decimals": "1",
"statView": "grid",
"baseColor": "#4CBB17",
"calculation": "last"
},
"timeseries": {
"legend": {
"view": "list",
"values": []
}
},
"node_configs": [
{
"exp": "sum by(host_name) (system_memory_usage{host_name=\"$hostname\",state=\"used\"}) / sum by(host_name) (system_memory_usage{host_name=\"$hostname\"})",
"stat": "",
"type": "query",
"limit": null,
"hidden": false,
"metric": "",
"nodeId": "A",
"region": "",
"source": "kloudmate",
"dataset": "metrics",
"filters": [
{
"type": "string",
"field": "host_name",
"value": "$hostname",
"operator": "="
},
{
"type": "string",
"field": "state",
"value": "used",
"operator": "="
}
],
"groupBy": [],
"orderBy": [],
"interval": "",
"namespace": "",
"dimensions": [],
"metricType": "",
"query_type": "qb",
"time_range": {
"to": 0,
"from": 600
},
"aggregation": {
"stat": "LAST",
"type": "",
"unit": "1",
"field": "",
"value": "system_memory_utilization",
"metric": "system_memory_utilization",
"spatial": "LAST",
"temporal": "AVG",
"metricType": "gauge",
"temporality": "unspecified"
},
"datasourceId": "kloudmate",
"responseType": "series"
}
],
"time_options": {
"override": false,
"time_shift": ""
}
},
{
"id": "5o36bl0u15",
"tz": "local",
"axis": {
"x": {
"date_style": "auto"
}
},
"title": "CPU Usage",
"panelType": "STATS",
"timeRange": "1h",
"statConfig": {
"format": "percentage",
"decimals": "1",
"statView": "grid",
"baseColor": "#4CBB17",
"calculation": "last"
},
"timeseries": {
"legend": {
"view": "list",
"values": []
}
},
"node_configs": [
{
"exp": "avg by(host_name) (1 - system_cpu_utilization{host_name=\"$hostname\", state=\"idle\"})",
"stat": "",
"type": "query",
"limit": null,
"hidden": true,
"metric": "",
"nodeId": "A",
"region": "",
"source": "kloudmate",
"dataset": "metrics",
"filters": [
{
"type": "string",
"field": "host_name",
"value": "$hostname",
"operator": "="
},
{
"type": "string",
"field": "state",
"value": "idle",
"operator": "="
}
],
"groupBy": [
{
"type": "string",
"field": "host_name"
}
],
"orderBy": [],
"interval": "",
"namespace": "",
"dimensions": [],
"metricType": "",
"query_type": "qb",
"time_range": {
"to": 0,
"from": 600
},
"aggregation": {
"stat": "AVG",
"type": "",
"unit": "1",
"field": "",
"value": "system_cpu_utilization",
"metric": "system_cpu_utilization",
"ranking": {
"func": "None"
},
"spatial": "AVG",
"temporal": "AVG",
"metricType": "gauge",
"temporality": "unspecified"
},
"datasourceId": "kloudmate",
"responseType": "series",
"promql_query_type": "instant"
},
{
"type": "expression",
"hidden": false,
"nodeId": "B",
"reducer": "last",
"expression": "1 - $A",
"expressionType": "math"
}
],
"time_options": {
"override": false,
"time_shift": ""
}
},
{
"id": "bj3271tqzx5",
"tz": "local",
"axis": {
"x": {
"date_style": "auto"
}
},
"title": "File System Usage",
"panelType": "STATS",
"timeRange": "1h",
"statConfig": {
"format": "percentage",
"decimals": 1,
"statView": "grid",
"baseColor": "#4CBB17",
"calculation": "last"
},
"timeseries": {
"legend": {
"view": "list",
"values": []
}
},
"node_configs": [
{
"exp": "sum by(host_name) (system_filesystem_usage{host_name=\"$hostname\",state=\"used\",device!~\"/dev/loop.*\", device!~\"tmpfs|nsfs\"}) / sum by(host_name) (system_filesystem_usage{host_name=\"$hostname\",device!~\"/dev/loop.*\", device!~\"tmpfs|nsfs\"})",
"stat": "",
"type": "query",
"limit": "",
"hidden": false,
"metric": "",
"nodeId": "A",
"region": "",
"source": "kloudmate",
"dataset": "metrics",
"filters": [],
"groupBy": [],
"orderBy": [],
"interval": "",
"namespace": "",
"dimensions": [],
"metricType": "",
"query_type": "promql",
"time_range": {
"to": 0,
"from": 600
},
"aggregation": {
"stat": "AVG",
"type": "",
"field": ""
},
"datasourceId": "kloudmate",
"responseType": "series"
}
]
},
{
"id": "9ud8nh2e0xh",
"tz": "local",
"axis": {
"x": {
"date_style": "auto"
}
},
"title": "Inode Usage",
"panelType": "STATS",
"timeRange": "1h",
"statConfig": {
"format": "percentage",
"decimals": 1,
"statView": "grid",
"baseColor": "#4CBB17",
"calculation": "last"
},
"timeseries": {
"legend": {
"view": "list",
"values": []
}
},
"node_configs": [
{
"exp": "sum by(host_name) (system_filesystem_inodes_usage{host_name=\"$hostname\",state=\"used\",device!~\"/dev/loop.*\",device!~\"tmpfs|nsfs\"}) / sum by(host_name) (system_filesystem_inodes_usage{host_name=\"$hostname\",device!~\"/dev/loop.*\",device!~\"tmpfs|nsfs\"})",
"stat": "",
"type": "query",
"limit": "",
"hidden": false,
"metric": "",
"nodeId": "A",
"region": "",
"source": "kloudmate",
"dataset": "metrics",
"filters": [],
"groupBy": [],
"orderBy": [],
"interval": "",
"namespace": "",
"dimensions": [],
"metricType": "",
"query_type": "promql",
"time_range": {
"to": 0,
"from": 600
},
"aggregation": {
"stat": "AVG",
"type": "",
"field": ""
},
"datasourceId": "kloudmate",
"responseType": "series"
}
]
},
{
"id": "n4ftzz92bj",
"tz": "local",
"axis": {
"x": {
"date_style": "auto"
},
"y": {
"format": "bytes",
"decimals": "1"
}
},
"STATS": {},
"title": "Disk IO",
"panelType": "TimeSeries",
"timeRange": "30m",
"TimeSeries": {},
"statConfig": {
"format": "bytes",
"decimals": 3,
"statView": "grid",
"baseColor": "#4CBB17",
"calculation": "last"
},
"timeseries": {
"legend": {
"view": "list",
"values": []
}
},
"node_configs": [
{
"exp": "avg by(host_name) (irate(system_disk_io{host_name=\"$hostname\",direction=\"read\",device!~\"loop.*\", device!~\"tmpfs|nsfs\"}[5m]))",
"stat": "",
"type": "query",
"limit": null,
"hidden": false,
"metric": "",
"nodeId": "A",
"region": "",
"source": "kloudmate",
"dataset": "metrics",
"filters": [
{
"type": "string",
"field": "host_name",
"value": "$hostname",
"operator": "="
},
{
"type": "string",
"field": "device",
"value": "tmpfs",
"operator": "NOT_CONTAINS"
},
{
"type": "string",
"field": "device",
"value": "nsfs",
"operator": "NOT_CONTAINS"
},
{
"type": "string",
"field": "device",
"value": "loop",
"operator": "NOT_CONTAINS"
}
],
"groupBy": [
{
"type": "string",
"field": "direction"
},
{
"type": "string",
"field": "host_name"
}
],
"orderBy": [],
"interval": "",
"namespace": "",
"dimensions": [],
"metricType": "",
"query_type": "qb",
"time_range": {
"to": 0,
"from": 600
},
"aggregation": {
"stat": "AVG",
"type": "",
"unit": "By",
"field": "",
"value": "system_disk_io",
"metric": "system_disk_io",
"ranking": {
"func": "None"
},
"spatial": "SUM",
"temporal": "RATE",
"metricType": "sum",
"temporality": "cumulative"
},
"datasourceId": "kloudmate",
"legendFormat": "{{direction}}",
"responseType": "series"
}
],
"time_options": {
"override": false,
"time_shift": ""
}
},
{
"id": "ngq5aed288",
"tz": "local",
"axis": {
"x": {
"date_style": "auto"
},
"y": {
"format": "bytes",
"decimals": 1
}
},
"title": "Memory Usage",
"panelType": "TimeSeries",
"timeRange": "1h",
"statConfig": {
"statView": "grid",
"baseColor": "#4CBB17",
"calculation": "last"
},
"timeseries": {
"legend": {
"view": "list",
"values": []
}
},
"node_configs": [
{
"exp": "system_memory_usage{host_name=\"$hostname\",state=~\"buffered|cached|free|used\"}",
"stat": "",
"type": "query",
"limit": "",
"hidden": false,
"metric": "",
"nodeId": "A",
"region": "",
"source": "kloudmate",
"dataset": "metrics",
"filters": [],
"groupBy": [],
"orderBy": [],
"interval": "",
"namespace": "",
"dimensions": [],
"metricType": "",
"query_type": "promql",
"time_range": {
"to": 0,
"from": 600
},
"aggregation": {
"stat": "AVG",
"type": "",
"field": ""
},
"datasourceId": "kloudmate",
"legendFormat": "{{state}}",
"responseType": "series"
}
]
},
{
"id": "e7qt7djxq5d",
"tz": "local",
"axis": {
"x": {
"date_style": "auto"
},
"y": {
"format": "percentage",
"decimals": 1
}
},
"title": "CPU Utilisation",
"panelType": "TimeSeries",
"timeRange": "1h",
"statConfig": {
"statView": "grid",
"baseColor": "#4CBB17",
"calculation": "last"
},
"timeseries": {
"legend": {
"view": "list",
"values": []
}
},
"node_configs": [
{
"exp": "avg by(host_name) (1 - system_cpu_utilization{host_name=\"$hostname\", state=\"idle\"})",
"stat": "",
"type": "query",
"limit": "",
"hidden": false,
"metric": "",
"nodeId": "A",
"region": "",
"source": "kloudmate",
"dataset": "metrics",
"filters": [],
"groupBy": [],
"orderBy": [],
"interval": "",
"namespace": "",
"dimensions": [],
"metricType": "",
"query_type": "promql",
"time_range": {
"to": 0,
"from": 600
},
"aggregation": {
"stat": "AVG",
"type": "",
"field": ""
},
"datasourceId": "kloudmate",
"legendFormat": "{{job}}",
"responseType": "series"
}
],
"time_options": {
"override": false,
"time_shift": ""
}
},
{
"id": "cgvuwpatfm",
"tz": "local",
"axis": {
"x": {
"date_style": "auto"
},
"y": {
"format": "unformatted"
}
},
"title": "Total Inode Usage",
"panelType": "TimeSeries",
"timeRange": "1h",
"statConfig": {
"statView": "grid",
"baseColor": "#4CBB17",
"calculation": "last"
},
"timeseries": {
"legend": {
"view": "list",
"values": []
}
},
"node_configs": [
{
"exp": "sum by(host_name, state) (system_filesystem_inodes_usage{host_name=\"$hostname\",device!~\"/dev/loop.*\",device!~\"tmpfs|nsfs\"})",
"stat": "",
"type": "query",
"limit": "",
"hidden": false,
"metric": "",
"nodeId": "A",
"region": "",
"source": "kloudmate",
"dataset": "metrics",
"filters": [],
"groupBy": [],
"orderBy": [],
"interval": "",
"namespace": "",
"dimensions": [],
"metricType": "",
"query_type": "promql",
"time_range": {
"to": 0,
"from": 600
},
"aggregation": {
"stat": "AVG",
"type": "",
"field": ""
},
"datasourceId": "kloudmate",
"legendFormat": "{{state}}",
"responseType": "series"
}
]
},
{
"id": "3pp5ei0vcrg",
"tz": "local",
"axis": {
"x": {
"date_style": "auto"
},
"y": {
"format": "bytes",
"suffix": "/s",
"decimals": "1"
}
},
"title": "Total Network IO",
"panelType": "TimeSeries",
"timeRange": "1h",
"statConfig": {
"statView": "grid",
"baseColor": "#4CBB17",
"calculation": "last"
},
"timeseries": {
"legend": {
"view": "list",
"values": []
}
},
"node_configs": [
{
"exp": "avg by(direction) (irate(system_network_io{host_name=\"$hostname\"}[5m]))",
"stat": "",
"type": "query",
"limit": null,
"hidden": false,
"metric": "",
"nodeId": "A",
"region": "",
"source": "kloudmate",
"dataset": "metrics",
"filters": [
{
"type": "string",
"field": "host_name",
"value": "$hostname",
"operator": "="
}
],
"groupBy": [
{
"type": "string",
"field": "direction"
}
],
"orderBy": [],
"interval": "",
"namespace": "",
"dimensions": [],
"metricType": "",
"query_type": "qb",
"time_range": {
"to": 0,
"from": 600
},
"aggregation": {
"stat": "AVG",
"type": "",
"unit": "By",
"field": "",
"value": "system_network_io",
"metric": "system_network_io",
"ranking": {
"func": "None"
},
"spatial": "AVG",
"temporal": "RATE",
"metricType": "sum",
"temporality": "cumulative"
},
"datasourceId": "kloudmate",
"legendFormat": "{{direction}}",
"responseType": "series"
}
],
"time_options": {
"override": false,
"time_shift": ""
}
},
{
"id": "9auxkevmznk",
"tz": "local",
"axis": {
"x": {
"date_style": "auto"
},
"y": {
"format": "number",
"suffix": "OPS/s",
"decimals": "2"
}
},
"title": "Total Disk Operations",
"panelType": "TimeSeries",
"timeRange": "1h",
"statConfig": {
"statView": "grid",
"baseColor": "#4CBB17",
"calculation": "last"
},
"timeseries": {
"legend": {
"view": "list",
"values": []
}
},
"node_configs": [
{
"exp": "avg by(direction) (irate(system_disk_operations{host_name=\"$hostname\",device!~\"loop.*\",device!~\"tmpfs|nsfs\"}[5m]))",
"stat": "",
"type": "query",
"limit": null,
"hidden": false,
"metric": "",
"nodeId": "A",
"region": "",
"source": "kloudmate",
"dataset": "metrics",
"filters": [
{
"type": "string",
"field": "host_name",
"value": "$hostname",
"operator": "="
},
{
"type": "string",
"field": "device",
"value": "loop",
"operator": "NOT_CONTAINS"
},
{
"type": "string",
"field": "device",
"value": "tmpfs",
"operator": "NOT_CONTAINS"
},
{
"type": "string",
"field": "device",
"value": "nsfs",
"operator": "NOT_CONTAINS"
}
],
"groupBy": [
{
"type": "string",
"field": "direction"
}
],
"orderBy": [],
"interval": "",
"namespace": "",
"dimensions": [],
"metricType": "",
"query_type": "qb",
"time_range": {
"to": 0,
"from": 600
},
"aggregation": {
"stat": "AVG",
"type": "",
"unit": "{operations}",
"field": "",
"value": "system_disk_operations",
"metric": "system_disk_operations",
"ranking": {
"func": "None"
},
"spatial": "AVG",
"temporal": "RATE",
"metricType": "sum",
"temporality": "cumulative"
},
"datasourceId": "kloudmate",
"legendFormat": "{{direction}}",
"responseType": "series"
}
],
"time_options": {
"override": false,
"time_shift": ""
}
},
{
"id": "39kusctaf57",
"tz": "local",
"axis": {
"x": {
"date_style": "auto"
},
"y": {
"format": "number",
"suffix": "%"
}
},
"title": "Top Process by Memory Utilization",
"panelType": "TimeSeries",
"timeRange": "10m",
"statConfig": {
"statView": "grid",
"baseColor": "#4CBB17",
"calculation": "last"
},
"timeseries": {
"legend": {
"view": "list",
"values": []
}
},
"node_configs": [
{
"exp": "topk(5,\r\n sum by(process_executable_name) (\r\n process_memory_utilization{host_name=\"$hostname\"}\r\n )\r\n)",
"page": 1,
"stat": "",
"type": "query",
"limit": null,
"hidden": false,
"metric": "",
"nodeId": "A",
"region": "",
"source": "kloudmate",
"dataset": "metrics",
"filters": [],
"groupBy": [],
"orderBy": [],
"interval": "",
"namespace": "",
"dimensions": [],
"metricType": "",
"query_type": "promql",
"time_range": {
"to": 0,
"from": 600
},
"aggregation": {
"stat": "AVG",
"type": "",
"field": ""
},
"datasourceId": "kloudmate",
"legendFormat": "{{process_executable_name}}",
"responseType": "series"
}
],
"time_options": {
"override": false,
"time_shift": ""
}
},
{
"id": "4d5m4pwg654",
"tz": "local",
"axis": {
"x": {
"date_style": "auto"
},
"y": {
"suffix": "%"
}
},
"title": "Top Process by CPU Utilization",
"panelType": "TimeSeries",
"timeRange": "1h",
"statConfig": {
"statView": "grid",
"baseColor": "#4CBB17",
"calculation": "last"
},
"timeseries": {
"legend": {
"view": "list",
"values": []
}
},
"node_configs": [
{
"exp": "topk(5,\r\n sum by(process_executable_name) (\r\n process_cpu_utilization{host_name=\"$hostname\"}\r\n ) * 100\r\n)",
"page": 1,
"stat": "",
"type": "query",
"limit": null,
"hidden": false,
"metric": "",
"nodeId": "A",
"region": "",
"source": "kloudmate",
"dataset": "metrics",
"filters": [],
"groupBy": [],
"orderBy": [],
"interval": "",
"namespace": "",
"dimensions": [],
"metricType": "",
"query_type": "promql",
"time_range": {
"to": 0,
"from": 600
},
"aggregation": {
"stat": "AVG",
"type": "",
"field": ""
},
"datasourceId": "kloudmate",
"legendFormat": "{{process_executable_name}}",
"responseType": "series"
}
],
"time_options": {
"override": false,
"time_shift": ""
}
},
{
"id": "2kem3nrdwnr",
"tz": "local",
"axis": {
"x": {
"date_style": "auto"
},
"y": {
"format": "bytes",
"decimals": 3
}
},
"table": {
"columns": [
{
"key": "A:AVG()",
"rename": ""
},
{
"key": "state",
"rename": ""
},
{
"key": "host_name",
"rename": ""
}
]
},
"title": "Available storage",
"tooltip": {
"mode": "all"
},
"panelType": "TimeSeries",
"pie_chart": {
"legend": {
"mode": "list",
"show": true,
"values": [
"formattedPercent"
],
"placement": "right"
},
"display": {
"type": "pie",
"labels": [
"name"
]
},
"formatter": {
"format": "bytes"
},
"value_options": {
"type": "reduce",
"limit": 20,
"reduce": "last",
"columns": [
"numeric"
]
}
},
"timeRange": "15m",
"TimeSeries": {},
"statConfig": {
"statView": "grid",
"baseColor": "#4CBB17",
"calculation": "last"
},
"timeseries": {
"legend": {
"view": "list",
"values": []
}
},
"node_configs": [
{
"exp": "sum(system_filesystem_usage) by (host_name)",
"stat": "",
"type": "query",
"limit": null,
"hidden": false,
"metric": "",
"nodeId": "A",
"region": "",
"source": "kloudmate",
"dataset": "metrics",
"filters": [
{
"type": "string",
"field": "host_name",
"value": "$hostname",
"operator": "="
}
],
"groupBy": [
{
"type": "string",
"field": "state"
},
{
"type": "string",
"field": "host_name"
}
],
"orderBy": [],
"interval": "",
"namespace": "",
"dimensions": [],
"metricType": "",
"query_type": "qb",
"time_range": {
"to": 0,
"from": 600
},
"aggregation": {
"stat": "AVG",
"type": "",
"unit": "By",
"field": "",
"value": "system_filesystem_usage",
"metric": "system_filesystem_usage",
"ranking": {
"func": "None"
},
"spatial": "SUM",
"temporal": "LAST",
"metricType": "gauge",
"temporality": "unspecified"
},
"datasourceId": "kloudmate",
"legendFormat": "{{state}}",
"responseType": "series"
}
],
"time_options": {
"override": false,
"time_shift": ""
}
},
{
"id": "eqcdu8s4roc",
"tz": "local",
"axis": {
"x": {
"date_style": "auto"
},
"y": {
"format": "duration",
"decimals": 3,
"multiplyBy": 1000
}
},
"STATS": {},
"title": "System Uptime",
"panelType": "STATS",
"timeRange": "5m",
"statConfig": {
"format": "duration",
"statView": "grid",
"baseColor": "#4CBB17",
"multiplyBy": "1000",
"calculation": "last"
},
"timeseries": {
"legend": {
"view": "list",
"values": []
}
},
"node_configs": [
{
"page": 1,
"stat": "",
"type": "query",
"hidden": false,
"metric": "",
"nodeId": "A",
"region": "",
"source": "kloudmate",
"dataset": "metrics",
"filters": [
{
"type": "string",
"field": "host_name",
"value": "$hostname",
"operator": "="
}
],
"groupBy": [],
"orderBy": [],
"interval": "",
"namespace": "",
"dimensions": [],
"metricType": "",
"time_range": {
"to": 0,
"from": 600
},
"aggregation": {
"stat": "AVG",
"type": "",
"unit": "s",
"field": "",
"value": "system_uptime",
"metric": "system_uptime",
"spatial": "LAST",
"temporal": "LAST",
"metricType": "gauge",
"temporality": "unspecified"
},
"datasourceId": "kloudmate",
"responseType": "series"
}
],
"time_options": {
"override": false,
"time_shift": ""
}
}
],
"timeRange": "10m",
"variables": [
{
"id": "3195da0e-571b-45fa-b9c3-2b83c06d81c2",
"name": "hostname",
"type": "query",
"label": "hostname",
"config": {
"otel": {
"key": {
"type": "string",
"field": "host_name"
},
"dataset": "metrics",
"filters": []
},
"source": "cloudwatch",
"queryType": "otel.values"
},
"is_multi": false,
"description": "",
"usedInPanels": [
{
"id": "0lnihagpoyp",
"name": "Memory Usage"
},
{
"id": "5o36bl0u15",
"name": "CPU Usage"
},
{
"id": "bj3271tqzx5",
"name": "File System Usage"
},
{
"id": "9ud8nh2e0xh",
"name": "Inode Usage"
},
{
"id": "n4ftzz92bj",
"name": "Disk IO (read)"
},
{
"id": "6m1le2t992k",
"name": "Disk IO (write)"
},
{
"id": "ngq5aed288",
"name": "Memory Usage"
},
{
"id": "e7qt7djxq5d",
"name": "CPU Utilisation"
},
{
"id": "o66mqp4s6jb",
"name": "CPU Idle"
},
{
"id": "1t5ak90uf4o",
"name": "Available storage"
},
{
"id": "1hnt5y731r3",
"name": "Disk Utilization"
},
{
"id": "lmw6b9asqef",
"name": "Average CPU load"
},
{
"id": "cgvuwpatfm",
"name": "Total Inode Usage"
},
{
"id": "3pp5ei0vcrg",
"name": "Total Network IO"
},
{
"id": "31x8lmqjw4k",
"name": "Total Disk IO "
},
{
"id": "91jwq1wn0n5",
"name": "Total File System Usage"
},
{
"id": "9auxkevmznk",
"name": "Total Disk Operations"
}
],
"usesVariables": [],
"show_all_option": true,
"usedInVariables": []
}
],
"panel_layouts": [
{
"h": 5,
"i": "0lnihagpoyp",
"w": 4,
"x": 4,
"y": 0,
"minH": 1,
"minW": 1,
"moved": false,
"static": false
},
{
"h": 5,
"i": "5o36bl0u15",
"w": 4,
"x": 0,
"y": 0,
"minH": 1,
"minW": 1,
"moved": false,
"static": false
},
{
"h": 5,
"i": "bj3271tqzx5",
"w": 4,
"x": 8,
"y": 0,
"minH": 1,
"minW": 1,
"moved": false,
"static": false
},
{
"h": 5,
"i": "9ud8nh2e0xh",
"w": 4,
"x": 12,
"y": 0,
"minH": 1,
"minW": 1,
"moved": false,
"static": false
},
{
"h": 10,
"i": "n4ftzz92bj",
"w": 12,
"x": 0,
"y": 25,
"minH": 1,
"minW": 1,
"moved": false,
"static": false
},
{
"h": 10,
"i": "ngq5aed288",
"w": 12,
"x": 12,
"y": 5,
"minH": 1,
"minW": 1,
"moved": false,
"static": false
},
{
"h": 10,
"i": "e7qt7djxq5d",
"w": 12,
"x": 0,
"y": 5,
"minH": 1,
"minW": 1,
"moved": false,
"static": false
},
{
"h": 10,
"i": "cgvuwpatfm",
"w": 12,
"x": 0,
"y": 45,
"minH": 1,
"minW": 1,
"moved": false,
"static": false
},
{
"h": 10,
"i": "3pp5ei0vcrg",
"w": 12,
"x": 0,
"y": 35,
"minH": 1,
"minW": 1,
"moved": false,
"static": false
},
{
"h": 10,
"i": "9auxkevmznk",
"w": 12,
"x": 12,
"y": 35,
"minH": 1,
"minW": 1,
"moved": false,
"static": false
},
{
"h": 10,
"i": "39kusctaf57",
"w": 12,
"x": 12,
"y": 15,
"minH": 1,
"minW": 1,
"moved": false,
"static": false
},
{
"h": 10,
"i": "4d5m4pwg654",
"w": 12,
"x": 0,
"y": 15,
"minH": 1,
"minW": 1,
"moved": false,
"static": false
},
{
"h": 10,
"i": "2kem3nrdwnr",
"w": 12,
"x": 12,
"y": 25,
"minH": 1,
"minW": 1,
"moved": false,
"static": false
},
{
"h": 5,
"i": "eqcdu8s4roc",
"w": 8,
"x": 16,
"y": 0,
"minH": 1,
"minW": 1,
"moved": false,
"static": false
}
],
"default_region": "us-east-1"
},
"tags": []
}