<- Back to Templates
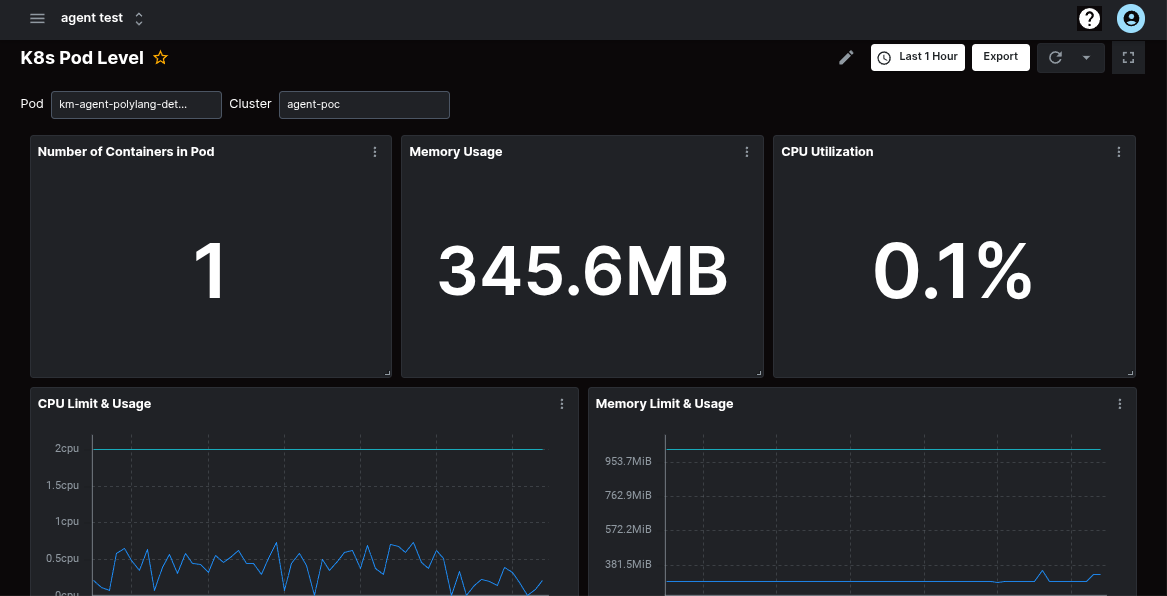
Kubernetes Pod Dashboard
By KloudMate
Monitoring Kubernetes pods with KM Agent provides deep visibility into the performance and health of the smallest deployable units in a cluster, you can collect pod-level metrics such as CPU and memory requests vs. usage and network traffic.
Template JSON
{
"name": "Kubernetes Pod Dashboard",
"description": "",
"data": {
"tz": "local",
"links": [],
"panels": [
{
"id": "n55chhotln",
"tz": "local",
"axis": {
"x": {
"date_style": "auto"
},
"y": {
"format": "number",
"decimals": 3
}
},
"title": "Memory Page Faults",
"panelType": "TimeSeries",
"timeRange": "1h",
"statConfig": {
"statView": "grid",
"baseColor": "#4CBB17",
"calculation": "last"
},
"timeseries": {
"legend": {
"view": "list",
"values": []
}
},
"description": "Number of major page faults that occurred inside a pod",
"node_configs": [
{
"page": 1,
"stat": "",
"type": "query",
"hidden": false,
"metric": "",
"nodeId": "A",
"region": "",
"source": "kloudmate",
"dataset": "metrics",
"filters": [
{
"type": "string",
"field": "k8s_pod_name",
"value": "$pod",
"operator": "="
},
{
"type": "string",
"field": "k8s_cluster_name",
"value": "$cluster",
"operator": "="
},
{
"type": "string",
"field": "k8s_namespace_name",
"value": "$namespace",
"operator": "="
}
],
"groupBy": [],
"orderBy": [],
"interval": "",
"namespace": "",
"dimensions": [],
"metricType": "",
"time_range": {
"to": 0,
"from": 600
},
"aggregation": {
"stat": "LAST",
"type": "",
"unit": "1",
"field": "",
"value": "k8s_pod_memory_major_page_faults",
"metric": "k8s_pod_memory_major_page_faults",
"metricType": "Gauge",
"temporality": "Cumulative"
},
"datasourceId": "kloudmate",
"legendFormat": "Major Page Fault"
}
],
"time_options": {
"override": false,
"time_shift": ""
}
},
{
"id": "0tjq9pawkx5i",
"tz": "local",
"axis": {
"x": {
"date_style": "auto"
},
"y": {
"format": "number",
"decimals": 3
}
},
"title": "Network Errors",
"tooltip": {
"mode": "all"
},
"panelType": "TimeSeries",
"timeRange": "1h",
"statConfig": {
"statView": "grid",
"baseColor": "#4CBB17",
"calculation": "last"
},
"timeseries": {
"legend": {
"view": "list",
"values": []
}
},
"description": "Number of Network IO errors in the Pod",
"node_configs": [
{
"page": 1,
"stat": "",
"type": "query",
"hidden": false,
"metric": "",
"nodeId": "A",
"region": "",
"source": "kloudmate",
"dataset": "metrics",
"filters": [
{
"type": "string",
"field": "k8s_pod_name",
"value": "$pod",
"operator": "="
},
{
"type": "string",
"field": "cluster",
"value": "$cluster",
"operator": "="
}
],
"groupBy": [
{
"type": "string",
"field": "direction"
}
],
"orderBy": [],
"interval": "",
"namespace": "",
"dimensions": [],
"metricType": "",
"time_range": {
"to": 0,
"from": 600
},
"aggregation": {
"stat": "AVG",
"type": "",
"unit": "1",
"field": "",
"value": "k8s_pod_network_errors",
"metric": "k8s_pod_network_errors",
"metricType": "Sum",
"temporality": "Cumulative"
},
"datasourceId": "kloudmate",
"legendFormat": "{{direction}}"
}
],
"time_options": {
"override": false,
"time_shift": ""
}
},
{
"id": "bc6itqfo3n",
"tz": "local",
"axis": {
"x": {
"date_style": "auto"
},
"y": {
"format": "bytes",
"suffix": "/s",
"decimals": 1
}
},
"title": "Network IO/s",
"tooltip": {
"mode": "all"
},
"panelType": "TimeSeries",
"timeRange": "1h",
"statConfig": {
"statView": "grid",
"baseColor": "#4CBB17",
"calculation": "last"
},
"timeseries": {
"legend": {
"view": "table",
"values": [
{
"label": "Max",
"value": "max"
},
{
"label": "Last",
"value": "last"
}
]
}
},
"description": "Total Network bytes IO/s by the Pod",
"node_configs": [
{
"page": 1,
"stat": "",
"type": "query",
"hidden": false,
"metric": "",
"nodeId": "A",
"region": "",
"source": "kloudmate",
"dataset": "metrics",
"filters": [
{
"type": "string",
"field": "k8s_pod_name",
"value": "$pod",
"operator": "="
},
{
"type": "string",
"field": "k8s_cluster_name",
"value": "$cluster",
"operator": "="
},
{
"type": "string",
"field": "k8s_namespace_name",
"value": "$namespace",
"operator": "="
}
],
"groupBy": [
{
"type": "string",
"field": "direction"
}
],
"orderBy": [],
"interval": "",
"namespace": "",
"dimensions": [],
"metricType": "",
"time_range": {
"to": 0,
"from": 600
},
"aggregation": {
"stat": "RATE",
"type": "",
"unit": "By",
"field": "",
"range": "5m",
"value": "k8s_pod_network_io_rate",
"metric": "k8s_pod_network_io_rate",
"metricType": "Sum",
"temporality": "Cumulative"
},
"datasourceId": "kloudmate",
"legendFormat": "{{direction}}"
}
],
"time_options": {
"override": false,
"time_shift": ""
}
},
{
"id": "a82t3be8gzk",
"tz": "local",
"axis": {
"x": {
"date_style": "auto"
},
"y": {
"format": "bytes",
"decimals": 3
}
},
"title": "Filesystem",
"tooltip": {
"mode": "all"
},
"panelType": "TimeSeries",
"timeRange": "1h",
"statConfig": {
"statView": "grid",
"baseColor": "#4CBB17",
"calculation": "last"
},
"timeseries": {
"legend": {
"view": "list",
"values": []
}
},
"description": "Filesystem usage by the Pod",
"node_configs": [
{
"page": 1,
"stat": "",
"type": "query",
"limit": null,
"hidden": false,
"metric": "",
"nodeId": "A",
"region": "",
"source": "kloudmate",
"dataset": "metrics",
"filters": [
{
"type": "string",
"field": "k8s_pod_name",
"value": "$pod",
"operator": "="
},
{
"type": "string",
"field": "k8s_cluster_name",
"value": "$cluster",
"operator": "="
},
{
"type": "string",
"field": "k8s_namespace_name",
"value": "$namespace",
"operator": "="
}
],
"groupBy": [],
"orderBy": [],
"interval": "",
"namespace": "",
"dimensions": [],
"metricType": "",
"query_type": "qb",
"time_range": {
"to": 0,
"from": 600
},
"aggregation": {
"stat": "AVG",
"type": "",
"unit": "By",
"field": "",
"value": "k8s_pod_filesystem_capacity",
"metric": "k8s_pod_filesystem_capacity",
"metricType": "Gauge",
"temporality": "Cumulative"
},
"datasourceId": "kloudmate",
"legendFormat": "Capacity",
"responseType": "series"
},
{
"page": 1,
"stat": "",
"type": "query",
"limit": null,
"hidden": false,
"metric": "",
"nodeId": "B",
"region": "",
"source": "kloudmate",
"dataset": "metrics",
"filters": [
{
"type": "string",
"field": "k8s_pod_name",
"value": "$pod",
"operator": "="
},
{
"type": "string",
"field": "k8s_cluster_name",
"value": "$cluster",
"operator": "="
},
{
"type": "string",
"field": "k8s_namespace_name",
"value": "$namespace",
"operator": "="
}
],
"groupBy": [],
"orderBy": [],
"interval": "",
"namespace": "",
"dimensions": [],
"metricType": "",
"query_type": "qb",
"time_range": {
"to": 0,
"from": 600
},
"aggregation": {
"stat": "AVG",
"type": "",
"unit": "By",
"field": "",
"value": "k8s_pod_filesystem_usage",
"metric": "k8s_pod_filesystem_usage",
"metricType": "Gauge",
"temporality": "Cumulative"
},
"datasourceId": "kloudmate",
"legendFormat": "Usage",
"responseType": "series"
},
{
"page": 1,
"stat": "",
"type": "query",
"limit": null,
"hidden": false,
"metric": "",
"nodeId": "C",
"region": "",
"source": "kloudmate",
"dataset": "metrics",
"filters": [
{
"type": "string",
"field": "k8s_pod_name",
"value": "$pod",
"operator": "="
},
{
"type": "string",
"field": "k8s_cluster_name",
"value": "$cluster",
"operator": "="
},
{
"type": "string",
"field": "k8s_namespace_name",
"value": "$namespace",
"operator": "="
}
],
"groupBy": [],
"orderBy": [],
"interval": "",
"namespace": "",
"dimensions": [],
"metricType": "",
"query_type": "qb",
"time_range": {
"to": 0,
"from": 600
},
"aggregation": {
"stat": "AVG",
"type": "",
"unit": "By",
"field": "",
"value": "k8s_pod_filesystem_available",
"metric": "k8s_pod_filesystem_available",
"metricType": "Gauge",
"temporality": "Cumulative"
},
"datasourceId": "kloudmate",
"legendFormat": "Available",
"responseType": "series"
}
],
"time_options": {
"override": false,
"time_shift": ""
}
},
{
"id": "p9tvvc1n7n",
"tz": "local",
"axis": {
"x": {
"date_style": "auto"
},
"y": {
"format": "duration",
"decimals": 3,
"multiplyBy": 1000
}
},
"STATS": {},
"table": {},
"title": "Containers in Pod",
"panelType": "STATS",
"timeRange": "1h",
"statConfig": {
"color": {
"scheme": "fixed",
"fixedColor": "#4a4a4a"
},
"statView": "grid",
"baseColor": "#4CBB17",
"colorMode": "",
"calculation": "last"
},
"timeseries": {
"legend": {
"view": "list",
"values": []
}
},
"description": "Total number of containers in the Pod",
"node_configs": [
{
"page": 1,
"stat": "",
"type": "query",
"hidden": false,
"metric": "",
"nodeId": "A",
"region": "",
"source": "kloudmate",
"dataset": "metrics",
"filters": [
{
"type": "string",
"field": "k8s_pod_name",
"value": "$pod",
"operator": "="
},
{
"type": "string",
"field": "k8s_cluster_name",
"value": "$cluster",
"operator": "="
},
{
"type": "string",
"field": "k8s_namespace_name",
"value": "$namespace",
"operator": "="
}
],
"groupBy": [],
"orderBy": [],
"interval": "",
"namespace": "",
"dimensions": [],
"metricType": "",
"time_range": {
"to": 0,
"from": 600
},
"aggregation": {
"stat": "COUNT",
"type": "",
"unit": "s",
"field": "",
"value": "container_cpu_time",
"metric": "container_cpu_time",
"metricType": "Sum",
"temporality": "Cumulative"
},
"datasourceId": "kloudmate",
"responseType": "series"
}
],
"time_options": {
"override": false,
"time_shift": ""
}
},
{
"id": "05ylxjbpnd0j",
"tz": "local",
"axis": {
"x": {
"date_style": "auto"
},
"y": {
"format": "percentage",
"suffix": "",
"decimals": 3
}
},
"STATS": {},
"table": {
"columns": [
{
"key": "A:LAST()",
"format": {
"format": "number",
"decimals": 3
},
"rename": "CPU Used"
},
{
"key": "k8s_namespace_name",
"rename": ""
},
{
"key": "k8s_node_name",
"rename": ""
},
{
"key": "k8s_pod_name",
"rename": ""
},
{
"key": "B:LAST()",
"format": {
"format": "number",
"suffix": "{cpu}",
"decimals": 3
},
"rename": "CPU Lmit"
},
{
"key": "C:LAST()",
"format": {
"format": "number",
"suffix": "{cpu}",
"decimals": 3
},
"rename": "CPU Request"
},
{
"key": "D:LAST()",
"format": {
"format": "bytes",
"decimals": 2
},
"rename": "memory used"
},
{
"key": "E:LAST()",
"format": {
"format": "bytes",
"decimals": 2
},
"rename": "memory limit"
},
{
"key": "F:LAST()",
"format": {
"format": "bytes",
"decimals": 2
},
"rename": "memory request"
}
]
},
"title": "Pod Usage",
"tooltip": {
"mode": "all"
},
"panelType": "table",
"timeRange": "1h",
"statConfig": {
"format": "percentage",
"decimals": 1,
"statView": "grid",
"baseColor": "#4CBB17",
"calculation": "last"
},
"timeseries": {
"legend": {
"view": "list",
"values": []
}
},
"node_configs": [
{
"page": 1,
"stat": "",
"type": "query",
"limit": null,
"hidden": false,
"metric": "",
"nodeId": "A",
"region": "",
"source": "kloudmate",
"dataset": "metrics",
"filters": [
{
"type": "string",
"field": "k8s_pod_name",
"value": "$pod",
"operator": "="
},
{
"type": "string",
"field": "k8s_cluster_name",
"value": "$cluster",
"operator": "="
},
{
"type": "string",
"field": "k8s_namespace_name",
"value": "$namespace",
"operator": "="
}
],
"groupBy": [
{
"type": "string",
"field": "k8s_namespace_name"
},
{
"type": "string",
"field": "k8s_node_name"
},
{
"type": "string",
"field": "k8s_pod_name"
}
],
"orderBy": [],
"interval": "",
"namespace": "",
"dimensions": [],
"metricType": "",
"query_type": "qb",
"time_range": {
"to": 0,
"from": 600
},
"aggregation": {
"stat": "LAST",
"type": "",
"unit": "{cpu}",
"field": "",
"range": "5m",
"value": "k8s_pod_cpu_usage",
"metric": "k8s_pod_cpu_usage",
"metricType": "Gauge",
"temporality": "Cumulative"
},
"datasourceId": "kloudmate",
"legendFormat": "avg",
"responseType": "number"
},
{
"page": 1,
"stat": "",
"type": "query",
"limit": null,
"hidden": false,
"metric": "",
"nodeId": "B",
"region": "",
"source": "kloudmate",
"dataset": "metrics",
"filters": [
{
"type": "string",
"field": "k8s_pod_name",
"value": "$pod",
"operator": "="
},
{
"type": "string",
"field": "k8s_cluster_name",
"value": "$cluster",
"operator": "="
},
{
"type": "string",
"field": "k8s_namespace_name",
"value": "$namespace",
"operator": "="
}
],
"groupBy": [
{
"type": "string",
"field": "k8s_namespace_name"
},
{
"type": "string",
"field": "k8s_node_name"
},
{
"type": "string",
"field": "k8s_pod_name"
}
],
"orderBy": [],
"interval": "",
"namespace": "",
"dimensions": [],
"metricType": "",
"query_type": "qb",
"time_range": {
"to": 0,
"from": 600
},
"aggregation": {
"stat": "LAST",
"type": "",
"unit": "{cpu}",
"field": "",
"range": "5m",
"value": "k8s_container_cpu_limit",
"metric": "k8s_container_cpu_limit",
"metricType": "Gauge",
"temporality": "Cumulative"
},
"datasourceId": "kloudmate",
"legendFormat": "avg",
"responseType": "number"
},
{
"page": 1,
"stat": "",
"type": "query",
"limit": null,
"hidden": false,
"metric": "",
"nodeId": "C",
"region": "",
"source": "kloudmate",
"dataset": "metrics",
"filters": [
{
"type": "string",
"field": "k8s_pod_name",
"value": "$pod",
"operator": "="
},
{
"type": "string",
"field": "k8s_cluster_name",
"value": "$cluster",
"operator": "="
},
{
"type": "string",
"field": "k8s_namespace_name",
"value": "$namespace",
"operator": "="
}
],
"groupBy": [
{
"type": "string",
"field": "k8s_namespace_name"
},
{
"type": "string",
"field": "k8s_node_name"
},
{
"type": "string",
"field": "k8s_pod_name"
}
],
"orderBy": [],
"interval": "",
"namespace": "",
"dimensions": [],
"metricType": "",
"query_type": "qb",
"time_range": {
"to": 0,
"from": 600
},
"aggregation": {
"stat": "LAST",
"type": "",
"unit": "{cpu}",
"field": "",
"range": "5m",
"value": "k8s_container_cpu_request",
"metric": "k8s_container_cpu_request",
"metricType": "Gauge",
"temporality": "Cumulative"
},
"datasourceId": "kloudmate",
"legendFormat": "avg",
"responseType": "number"
},
{
"page": 1,
"stat": "",
"type": "query",
"limit": null,
"hidden": false,
"metric": "",
"nodeId": "D",
"region": "",
"source": "kloudmate",
"dataset": "metrics",
"filters": [
{
"type": "string",
"field": "k8s_pod_name",
"value": "$pod",
"operator": "="
},
{
"type": "string",
"field": "k8s_cluster_name",
"value": "$cluster",
"operator": "="
},
{
"type": "string",
"field": "k8s_namespace_name",
"value": "$namespace",
"operator": "="
}
],
"groupBy": [
{
"type": "string",
"field": "k8s_namespace_name"
},
{
"type": "string",
"field": "k8s_node_name"
},
{
"type": "string",
"field": "k8s_pod_name"
}
],
"orderBy": [],
"interval": "",
"namespace": "",
"dimensions": [],
"metricType": "",
"query_type": "qb",
"time_range": {
"to": 0,
"from": 600
},
"aggregation": {
"stat": "LAST",
"type": "",
"unit": "By",
"field": "",
"range": "5m",
"value": "k8s_pod_memory_usage",
"metric": "k8s_pod_memory_usage",
"metricType": "Gauge",
"temporality": "Cumulative"
},
"datasourceId": "kloudmate",
"legendFormat": "avg",
"responseType": "number"
},
{
"page": 1,
"stat": "",
"type": "query",
"limit": null,
"hidden": false,
"metric": "",
"nodeId": "E",
"region": "",
"source": "kloudmate",
"dataset": "metrics",
"filters": [
{
"type": "string",
"field": "k8s_pod_name",
"value": "$pod",
"operator": "="
},
{
"type": "string",
"field": "k8s_cluster_name",
"value": "$cluster",
"operator": "="
},
{
"type": "string",
"field": "k8s_namespace_name",
"value": "$namespace",
"operator": "="
}
],
"groupBy": [
{
"type": "string",
"field": "k8s_namespace_name"
},
{
"type": "string",
"field": "k8s_node_name"
},
{
"type": "string",
"field": "k8s_pod_name"
}
],
"orderBy": [],
"interval": "",
"namespace": "",
"dimensions": [],
"metricType": "",
"query_type": "qb",
"time_range": {
"to": 0,
"from": 600
},
"aggregation": {
"stat": "LAST",
"type": "",
"unit": "By",
"field": "",
"range": "5m",
"value": "k8s_container_memory_limit",
"metric": "k8s_container_memory_limit",
"metricType": "Gauge",
"temporality": "Cumulative"
},
"datasourceId": "kloudmate",
"legendFormat": "avg",
"responseType": "number"
},
{
"page": 1,
"stat": "",
"type": "query",
"limit": null,
"hidden": false,
"metric": "",
"nodeId": "F",
"region": "",
"source": "kloudmate",
"dataset": "metrics",
"filters": [
{
"type": "string",
"field": "k8s_pod_name",
"value": "$pod",
"operator": "="
},
{
"type": "string",
"field": "k8s_cluster_name",
"value": "$cluster",
"operator": "="
},
{
"type": "string",
"field": "k8s_namespace_name",
"value": "$namespace",
"operator": "="
}
],
"groupBy": [
{
"type": "string",
"field": "k8s_namespace_name"
},
{
"type": "string",
"field": "k8s_node_name"
},
{
"type": "string",
"field": "k8s_pod_name"
}
],
"orderBy": [],
"interval": "",
"namespace": "",
"dimensions": [],
"metricType": "",
"query_type": "qb",
"time_range": {
"to": 0,
"from": 600
},
"aggregation": {
"stat": "LAST",
"type": "",
"unit": "By",
"field": "",
"range": "5m",
"value": "k8s_container_memory_request",
"metric": "k8s_container_memory_request",
"metricType": "Gauge",
"temporality": "Cumulative"
},
"datasourceId": "kloudmate",
"legendFormat": "avg",
"responseType": "number"
}
],
"time_options": {
"override": false,
"time_shift": ""
}
},
{
"id": "74yx2hbwgp8",
"tz": "local",
"axis": {
"x": {
"date_style": "auto"
},
"y": {
"format": "percentage",
"decimals": 3
}
},
"STATS": {},
"title": "Pod CPU Request Utilization",
"panelType": "STATS",
"timeRange": "1h",
"statConfig": {
"color": {
"scheme": "fixed",
"fixedColor": "#4A90E2"
},
"format": "percentage",
"decimals": 1,
"statView": "grid",
"baseColor": "#4CBB17",
"colorMode": "",
"calculation": "last"
},
"timeseries": {
"legend": {
"view": "list",
"values": []
}
},
"description": "Represents how much CPU a pod is using compared to its requested CPU",
"node_configs": [
{
"page": 1,
"stat": "",
"type": "query",
"hidden": false,
"metric": "",
"nodeId": "A",
"region": "",
"source": "kloudmate",
"dataset": "metrics",
"filters": [
{
"type": "string",
"field": "k8s_cluster_name",
"value": "$cluster",
"operator": "="
},
{
"type": "string",
"field": "k8s_namespace_name",
"value": "$namespace",
"operator": "="
},
{
"type": "string",
"field": "k8s_pod_name",
"value": "$pod",
"operator": "="
}
],
"groupBy": [],
"orderBy": [],
"interval": "",
"namespace": "",
"dimensions": [],
"metricType": "",
"time_range": {
"to": 0,
"from": 600
},
"aggregation": {
"stat": "LAST",
"type": "",
"unit": "1",
"field": "",
"value": "k8s_container_cpu_request_utilization",
"metric": "k8s_container_cpu_request_utilization",
"metricType": "Gauge",
"temporality": "Cumulative"
},
"datasourceId": "kloudmate",
"responseType": "series"
}
],
"time_options": {
"override": false,
"time_shift": ""
}
},
{
"id": "4661dgn37u2",
"tz": "local",
"axis": {
"x": {
"date_style": "auto"
},
"y": {
"format": "percentage",
"decimals": 3
}
},
"STATS": {},
"title": "Pod CPU Limit Utilization ",
"panelType": "STATS",
"timeRange": "1h",
"statConfig": {
"color": {
"scheme": "fixed",
"fixedColor": "#75c022"
},
"format": "percentage",
"decimals": 1,
"statView": "grid",
"baseColor": "#4CBB17",
"colorMode": "",
"calculation": "last"
},
"timeseries": {
"legend": {
"view": "list",
"values": []
}
},
"description": "Represents how much CPU a Pod is using compared to its CPU limit",
"node_configs": [
{
"page": 1,
"stat": "",
"type": "query",
"hidden": false,
"metric": "",
"nodeId": "A",
"region": "",
"source": "kloudmate",
"dataset": "metrics",
"filters": [
{
"type": "string",
"field": "k8s_cluster_name",
"value": "$cluster",
"operator": "="
},
{
"type": "string",
"field": "k8s_namespace_name",
"value": "$namespace",
"operator": "="
},
{
"type": "string",
"field": "k8s_pod_name",
"value": "$pod",
"operator": "="
}
],
"groupBy": [],
"orderBy": [],
"interval": "",
"namespace": "",
"dimensions": [],
"metricType": "",
"time_range": {
"to": 0,
"from": 600
},
"aggregation": {
"stat": "LAST",
"type": "",
"unit": "1",
"field": "",
"value": "k8s_container_cpu_limit_utilization",
"metric": "k8s_container_cpu_limit_utilization",
"metricType": "Gauge",
"temporality": "Cumulative"
},
"datasourceId": "kloudmate",
"responseType": "series"
}
],
"time_options": {
"override": false,
"time_shift": ""
}
},
{
"id": "0fw0aaszksqt",
"tz": "local",
"axis": {
"x": {
"date_style": "auto"
},
"y": {
"format": "percentage",
"decimals": 3
}
},
"STATS": {},
"title": "Pod Memory Request Utilization ",
"panelType": "STATS",
"timeRange": "1h",
"statConfig": {
"color": {
"scheme": "fixed",
"fixedColor": "#e19b2a"
},
"format": "percentage",
"decimals": 1,
"statView": "grid",
"baseColor": "#4CBB17",
"colorMode": "",
"calculation": "last"
},
"timeseries": {
"legend": {
"view": "list",
"values": []
}
},
"description": "Represents how much Memory a pod is using compared to its requested Memory",
"node_configs": [
{
"page": 1,
"stat": "",
"type": "query",
"hidden": false,
"metric": "",
"nodeId": "A",
"region": "",
"source": "kloudmate",
"dataset": "metrics",
"filters": [
{
"type": "string",
"field": "k8s_cluster_name",
"value": "$cluster",
"operator": "="
},
{
"type": "string",
"field": "k8s_namespace_name",
"value": "$namespace",
"operator": "="
},
{
"type": "string",
"field": "k8s_pod_name",
"value": "$pod",
"operator": "="
}
],
"groupBy": [],
"orderBy": [],
"interval": "",
"namespace": "",
"dimensions": [],
"metricType": "",
"time_range": {
"to": 0,
"from": 600
},
"aggregation": {
"stat": "LAST",
"type": "",
"unit": "1",
"field": "",
"value": "k8s_container_memory_request_utilization",
"metric": "k8s_container_memory_request_utilization",
"metricType": "Gauge",
"temporality": "Cumulative"
},
"datasourceId": "kloudmate",
"responseType": "series"
}
],
"time_options": {
"override": false,
"time_shift": ""
}
},
{
"id": "pf0c24e3ru8",
"tz": "local",
"axis": {
"x": {
"date_style": "auto"
},
"y": {
"format": "percentage",
"decimals": 3
}
},
"STATS": {},
"title": "Pod Memory Limit Utilization ",
"panelType": "STATS",
"timeRange": "1h",
"statConfig": {
"color": {
"scheme": "fixed",
"fixedColor": "#f2efef"
},
"format": "percentage",
"decimals": 1,
"statView": "grid",
"baseColor": "#4CBB17",
"colorMode": "",
"calculation": "last"
},
"timeseries": {
"legend": {
"view": "list",
"values": []
}
},
"description": "Represents how much Memory a Pod is using compared to its Memory limit",
"node_configs": [
{
"page": 1,
"stat": "",
"type": "query",
"hidden": false,
"metric": "",
"nodeId": "A",
"region": "",
"source": "kloudmate",
"dataset": "metrics",
"filters": [
{
"type": "string",
"field": "k8s_cluster_name",
"value": "$cluster",
"operator": "="
},
{
"type": "string",
"field": "k8s_namespace_name",
"value": "$namespace",
"operator": "="
},
{
"type": "string",
"field": "k8s_pod_name",
"value": "$pod",
"operator": "="
}
],
"groupBy": [],
"orderBy": [],
"interval": "",
"namespace": "",
"dimensions": [],
"metricType": "",
"time_range": {
"to": 0,
"from": 600
},
"aggregation": {
"stat": "LAST",
"type": "",
"unit": "1",
"field": "",
"value": "k8s_container_memory_limit_utilization",
"metric": "k8s_container_memory_limit_utilization",
"metricType": "Gauge",
"temporality": "Cumulative"
},
"datasourceId": "kloudmate",
"responseType": "series"
}
],
"time_options": {
"override": false,
"time_shift": ""
}
},
{
"id": "e8wbor5qex5",
"tz": "local",
"axis": {
"x": {
"date_style": "auto"
},
"y": {
"format": "bytes",
"decimals": 2
}
},
"title": "Memory Usage by Container ",
"panelType": "TimeSeries",
"timeRange": "1h",
"statConfig": {
"statView": "grid",
"baseColor": "#4CBB17",
"calculation": "last"
},
"timeseries": {
"legend": {
"view": "table",
"values": [
{
"label": "Min",
"value": "min"
},
{
"label": "Max",
"value": "max"
},
{
"label": "Mean",
"value": "mean"
}
]
}
},
"node_configs": [
{
"page": 1,
"stat": "",
"type": "query",
"hidden": false,
"metric": "",
"nodeId": "A",
"region": "",
"source": "kloudmate",
"dataset": "metrics",
"filters": [
{
"type": "string",
"field": "k8s_cluster_name",
"value": "$cluster",
"operator": "="
},
{
"type": "string",
"field": "k8s_namespace_name",
"value": "$namespace",
"operator": "="
},
{
"type": "string",
"field": "k8s_pod_name",
"value": "$pod",
"operator": "="
}
],
"groupBy": [
{
"type": "string",
"field": "k8s_container_name"
}
],
"orderBy": [],
"interval": "",
"namespace": "",
"dimensions": [],
"metricType": "",
"time_range": {
"to": 0,
"from": 600
},
"aggregation": {
"stat": "LAST",
"type": "",
"unit": "By",
"field": "",
"value": "container_memory_usage",
"metric": "container_memory_usage",
"metricType": "Gauge",
"temporality": "Cumulative"
},
"datasourceId": "kloudmate"
}
],
"time_options": {
"override": false,
"time_shift": ""
}
},
{
"id": "31eizcqaf7c",
"tz": "local",
"axis": {
"x": {
"date_style": "auto"
},
"y": {
"format": "number",
"suffix": "{cpu}",
"decimals": 3
}
},
"title": "CPU Usage by Container ",
"panelType": "TimeSeries",
"timeRange": "1h",
"statConfig": {
"statView": "grid",
"baseColor": "#4CBB17",
"calculation": "last"
},
"timeseries": {
"legend": {
"view": "table",
"values": [
{
"label": "Min",
"value": "min"
},
{
"label": "Max",
"value": "max"
},
{
"label": "Mean",
"value": "mean"
}
]
}
},
"node_configs": [
{
"page": 1,
"stat": "",
"type": "query",
"hidden": false,
"metric": "",
"nodeId": "A",
"region": "",
"source": "kloudmate",
"dataset": "metrics",
"filters": [
{
"type": "string",
"field": "k8s_cluster_name",
"value": "$cluster",
"operator": "="
},
{
"type": "string",
"field": "k8s_namespace_name",
"value": "$namespace",
"operator": "="
},
{
"type": "string",
"field": "k8s_pod_name",
"value": "$pod",
"operator": "="
}
],
"groupBy": [
{
"type": "string",
"field": "k8s_container_name"
}
],
"orderBy": [],
"interval": "",
"namespace": "",
"dimensions": [],
"metricType": "",
"time_range": {
"to": 0,
"from": 600
},
"aggregation": {
"stat": "LAST",
"type": "",
"unit": "{cpu}",
"field": "",
"value": "container_cpu_usage",
"metric": "container_cpu_usage",
"metricType": "Gauge",
"temporality": "Cumulative"
},
"datasourceId": "kloudmate"
}
],
"time_options": {
"override": false,
"time_shift": ""
}
}
],
"timeRange": "1h",
"variables": [
{
"name": "cluster",
"type": "query",
"label": "Cluster",
"config": {
"otel": {
"key": "k8s_cluster_name",
"dataset": "metrics"
},
"source": "cloudwatch",
"queryType": "otel.values"
},
"is_multi": false,
"description": "",
"usedInPanels": [
{
"id": "212u1s3bluk",
"name": "CPU Utilization"
},
{
"id": "gf78ttltp5j",
"name": "Memory Usage"
},
{
"id": "n55chhotln",
"name": "Memory Page Faults"
},
{
"id": "0tjq9pawkx5i",
"name": "Network Errors"
},
{
"id": "a82t3be8gzk",
"name": "Filesytem"
},
{
"id": "p9tvvc1n7n",
"name": "Number of Containers in Pod"
},
{
"id": "dclxn594ynk",
"name": "CPU Limit & Usage"
},
{
"id": "fa945pcsgwn",
"name": "Memory Limit & Usage"
},
{
"id": "pne69vafrbo",
"name": "Memory Limit & Usage - Copy"
}
],
"usesVariables": [],
"show_all_option": false,
"usedInVariables": []
},
{
"name": "namespace",
"type": "query",
"label": "Namespace",
"config": {
"otel": {
"key": {
"type": "string",
"field": "k8s_namespace_name"
},
"dataset": "metrics",
"filters": [
{
"type": "string",
"field": "k8s_cluster_name",
"value": "$cluster",
"operator": "="
}
]
},
"source": "cloudwatch",
"queryType": "otel.values"
},
"is_multi": false,
"description": "",
"usedInPanels": [],
"usesVariables": [
{
"name": "cluster"
}
],
"show_all_option": false,
"usedInVariables": []
},
{
"name": "pod",
"type": "query",
"label": "Pod",
"config": {
"otel": {
"key": {
"type": "string",
"field": "k8s_pod_name"
},
"dataset": "metrics",
"filters": [
{
"type": "string",
"field": "k8s_namespace_name",
"value": "$namespace",
"operator": "="
}
]
},
"source": "cloudwatch",
"queryType": "otel.values"
},
"is_multi": false,
"description": "",
"show_all_option": false
}
],
"panel_layouts": [
{
"h": 9,
"i": "n55chhotln",
"w": 12,
"x": 12,
"y": 29,
"minH": 1,
"minW": 1,
"moved": false,
"static": false
},
{
"h": 9,
"i": "0tjq9pawkx5i",
"w": 12,
"x": 12,
"y": 20,
"minH": 1,
"minW": 1,
"moved": false,
"static": false
},
{
"h": 9,
"i": "bc6itqfo3n",
"w": 12,
"x": 0,
"y": 20,
"minH": 1,
"minW": 1,
"moved": false,
"static": false
},
{
"h": 9,
"i": "a82t3be8gzk",
"w": 12,
"x": 0,
"y": 29,
"minH": 1,
"minW": 1,
"moved": false,
"static": false
},
{
"h": 7,
"i": "p9tvvc1n7n",
"w": 4,
"x": 0,
"y": 0,
"minH": 1,
"minW": 1,
"moved": false,
"static": false
},
{
"h": 4,
"i": "05ylxjbpnd0j",
"w": 24,
"x": 0,
"y": 7,
"minH": 1,
"minW": 1,
"moved": false,
"static": false
},
{
"h": 7,
"i": "74yx2hbwgp8",
"w": 5,
"x": 4,
"y": 0,
"minH": 1,
"minW": 1,
"moved": false,
"static": false
},
{
"h": 7,
"i": "4661dgn37u2",
"w": 5,
"x": 9,
"y": 0,
"minH": 1,
"minW": 1,
"moved": false,
"static": false
},
{
"h": 7,
"i": "0fw0aaszksqt",
"w": 5,
"x": 14,
"y": 0,
"minH": 1,
"minW": 1,
"moved": false,
"static": false
},
{
"h": 7,
"i": "pf0c24e3ru8",
"w": 5,
"x": 19,
"y": 0,
"minH": 1,
"minW": 1,
"moved": false,
"static": false
},
{
"h": 9,
"i": "e8wbor5qex5",
"w": 12,
"x": 0,
"y": 11,
"minH": 1,
"minW": 1,
"moved": false,
"static": false
},
{
"h": 9,
"i": "31eizcqaf7c",
"w": 12,
"x": 12,
"y": 11,
"minH": 1,
"minW": 1,
"moved": false,
"static": false
}
],
"default_region": "us-east-1"
},
"tags": []
}